Hough(霍夫)直线检测
直线检测:对于边界上有 n 个点的点集,找出共线的点集和直线方程。
Hough 变换的原理
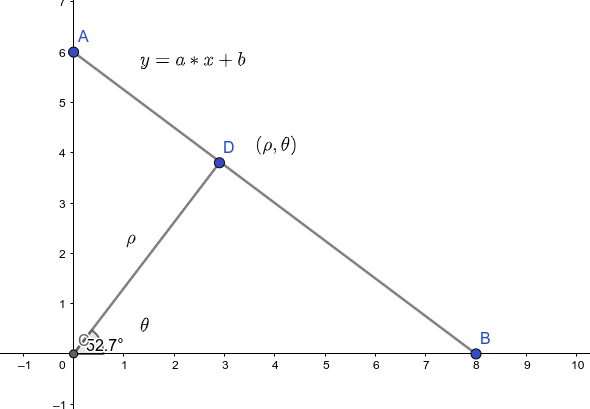
对于直线$y = a*x + b$,从原点做其垂线,如图中的$CD$。如果将其看做极坐标系,则$CD$可以用$(\rho, \theta)$表示。
怎么表达AB与CD的关系呢?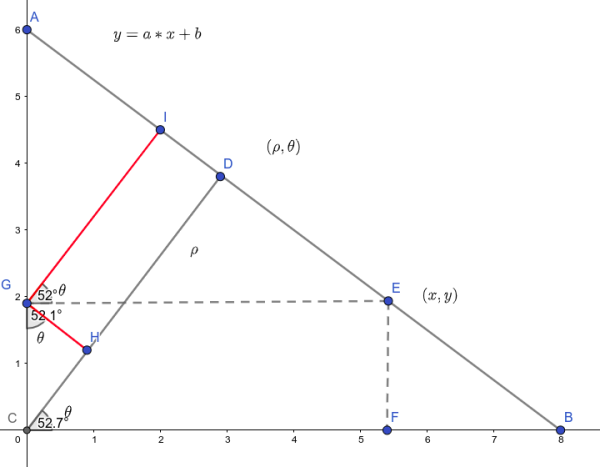
任取AB上一点E(x,y),做CD的垂线GH,AB的垂线GI。从而我们可以得到角度关系$\angle{IGE} = \angle {GHC} = \angle{DCB} = \theta$。
所以,$CH = y sin\theta, HD = GI = x cos\theta$,从而$CD = CH+HD = xcos\theta + ysin\theta$,即$\rho = xcos\theta + ysin\theta$。可以证明对于直线AB上的任意一点,都满足上式,即$\rho = xcos\theta + ysin\theta$是直线AB的表达式。
再看$\rho = xcos\theta + ysin\theta$,如果我们固定$x,y$,将$\theta$作为自变量,可以得到一个$\rho - \theta$的一个函数关系式。当$\theta$变化时(CD绕原点旋转时),AB也会随之变化(转动)。由于固定了$x,y$,所以直线AB一定会经过点$(x,y)$,所以它表达了经过点$(x,y)$的所有直线。
例如:$\rho = 3cos\theta + 2sin\theta$,曲线上每一个点$(\rho, \theta)$都可以表示一条经过点$(3,2)$的直线。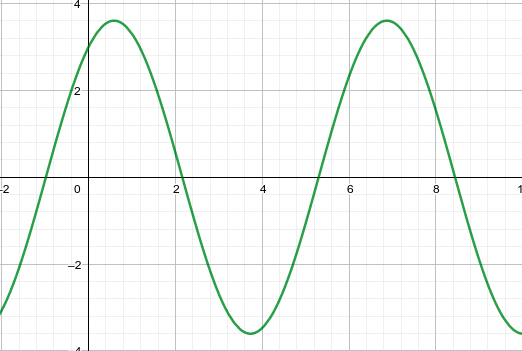
下图分别是$\rho = 3cos\theta + 2sin\theta$,$\rho = 2cos\theta + sin\theta$,$\rho = cos\theta$的图像,则分别表示所有经过点$(3,2)$,$(2,1)$,$(1,0)$的所有直线。那么图中的交点A表示什么?
经过点$(3,2)$,$(2,1)$,$(1,0)$的直线是同一条线。Amazing!这不就是说明$(3,2)$,$(2,1)$,$(1,0)$三点共线吗,感觉忽然发现了新大陆。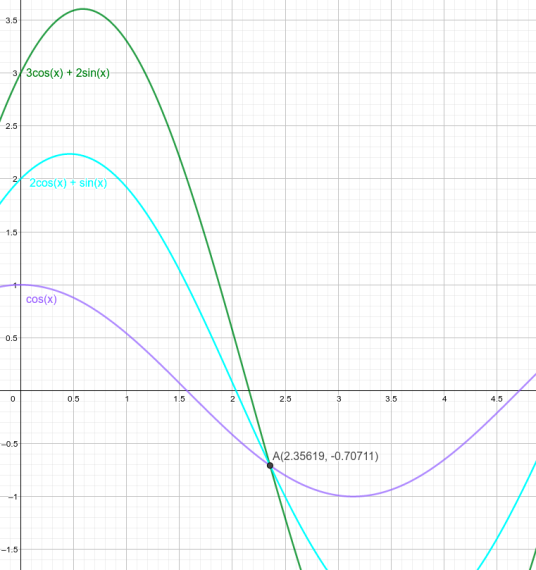
现在,我们已经找到了证明多个点共线的方法了。让我们重新梳理一下:
- 设有一个点集$R$,可得到$R$中任意点$(x_i,y_i)$对应的曲线$\rho_i = x_icos\theta + y_isin\theta$,$\theta \in [0, 2\pi)$。它表示了经过该点的所有直线。
- 设$(x_i, y_i),(x_j,y_j) \in R,i \ne j$ ,如果$\rho_i = x_icos\theta + y_isin\theta$与$\rho_j = x_jcos\theta + y_jsin\theta$有交点$A_{ij}(p_{ij}, \theta_{ij}$),就说明$(x_i, y_i),(x_j,y_j) $两点共线。
- 由$A_{ij}(p_{ij}, \theta_{ij})$可得到$(x_i, y_i),(x_j,y_j) $所在的直线$\rho_{ij} = xcos\theta_{ij} + ysin\theta_{ij}$。
刚才分析的都是基于连续的函数,如果要用算法实现,则需要将其离散化。
因为$\theta \in [0, 2\pi)$,但是如果用程序实现只能将$\theta$离散化,如令theta = range(0, 360) 取360个离散的值(具体的精度根据实际情况决定)。
算法实现
- 输入一幅RGB图
- 检测图中的边缘,可以使用Canny边缘检测得到一幅二值图像
- 开辟一个二维数组
array,初始值全部为0,用于存储共线点的个数;确定$\theta$的精度。 - 对于每一个边缘点$(x_i,y_i)$,使用公式$\rho_i = x_icos\theta + y_isin\theta$计算每一个$\theta$对应的,将作为数组
array的索引,将对应的数组元素值加1。 - 设定一个阈值,过滤出共线点较多的直线(也可以选取共线点最多的几条直线)。
- 将检测出的直线绘制到原图上。
Code[Python]
- hough_without_canny 中直接使用的是经过Canny检测后的二值图像。
- hough_with_canny 中调用了之前写过的Canny算法。(有时间会把Canny检测的代码也贴出来)
效果如下:
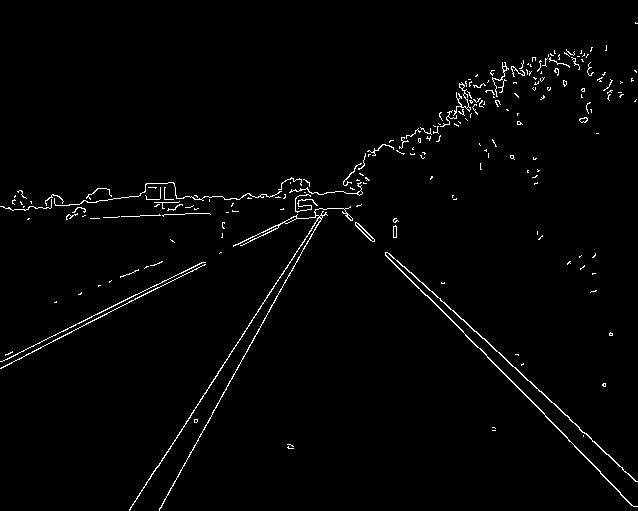
原图
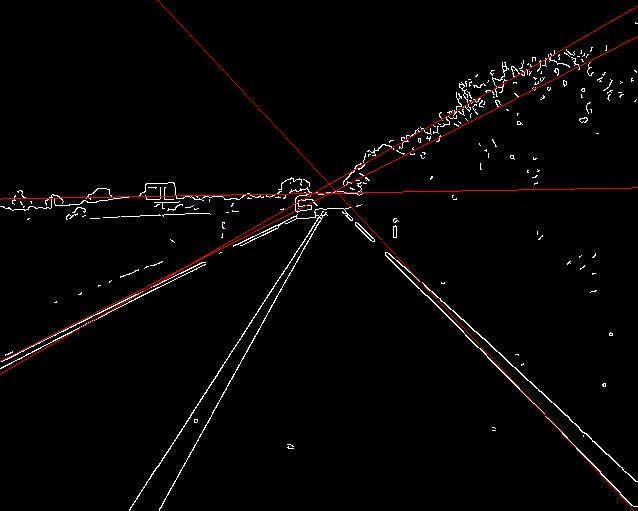
直线检测
from PIL import Image
import matplotlib.pyplot as plt
import numpy as np
import canny
import math
def to_gray(img):
height, width, _ = img.shape
gray = np.zeros((height, width), dtype=np.uint8)
k = np.array([0.299, 0.587, 0.114])
for i in range(height):
for j in range(width):
gray[i][j] = (k * img[i][j]).sum()
return gray
def to_rgb(img):
height, width = img.shape
rgb = np.zeros((height, width, 3), dtype=np.uint8)
for i in range(height):
for j in range(width):
rgb[i][j] = [img[i][j]] * 3
return rgb
def plot_line(img, expression):
if len(img.shape) != 3 or img.shape[2] != 3:
print('The image shape must be (height, width, 3)')
return img
height = img.shape[0]
width = img.shape[1]
def func(x, a, b):
return int(a * x + b)
for exp in expression:
a, b = exp
point = [(x, func(x, a, b)) for x in range(width)
if 0 <= func(x, a, b) < height]
for x, y in point:
img[y][x] = [255, 0, 0]
return img
def hough_check(img, precision=360, threshold=50, number=-1):
height, width = img.shape
theta = range(0, precision)
factor = 360 / precision
tab_height = len(theta)
tab_width = (height + width) << 1
tab = [[0] * tab_width for i in range(tab_height)]
for i in range(height):
for j in range(width):
if img[i][j] == 255:
for k in theta:
arc = k * factor * math.pi / 180
rho = int(j * math.cos(arc) + i * math.sin(arc))
tab[k][rho + height + width] += 1
line = []
for i in range(tab_height):
for j in range(tab_width):
if tab[i][j] > threshold:
# append theta (0-360) and rho to line
line.append((i * factor, j - height - width))
if number == -1 or len(line) <= number:
return line
else:
line.sort(key=lambda x: tab[int(x[0] / factor)][x[1] + height + width])
return line[0:number]
def get_expression(pair):
theta, rho = pair
theta = theta * math.pi / 180
k = -math.cos(theta) / (math.sin(theta) + 1e-8)
b = rho / (math.sin(theta) + 1e-8)
return k, b
def hough_with_canny():
filename = 'hf.jpg'
rgb_img = Image.open(filename)
gray_img = rgb_img.convert('L')
gray_array = np.array(gray_img)
# img = to_gray(img_array)
gray_array = canny.canny(gray_array, (3, 3))
line = hough_check(gray_array, number=5)
print('The number of lines is {}'.format(len(line)))
expression = [get_expression(x) for x in line]
rgb_array = to_rgb(gray_array)
rgb_array = plot_line(rgb_array, expression)
plt.figure()
plt.imshow(rgb_array)
plt.show()
def hough_without_canny():
filename = 'gray.jpg'
rgb_img = Image.open(filename)
gray_img = rgb_img.convert('L')
gray_array = np.array(gray_img)
rgb_array = to_rgb(gray_array)
line = hough_check(gray_array, number=5)
print('The number of lines is {}'.format(len(line)))
expression = [get_expression(x) for x in line]
rgb_array = plot_line(rgb_array, expression)
plt.figure()
plt.imshow(rgb_array)
plt.show()
if __name__ == '__main__':
# main()
hough_without_canny()